氣候變遷 | Energy Upgrade California

氣候變遷是什麼意思?

加州和整個地球的氣候模式正在改變。自20世紀中以來,氣候科學家追蹤到這些全球暖化趨勢,並將這些現象主要歸因於地球上人類的活動。我們使用化石燃料的行為導致大氣中二氧化碳和其他溫室氣體的濃度急劇升高。

在加州,大部分的能源仍然來自我們對化石燃料的依賴,如天然氣和石油。當化石燃料燃燒時,二氧化碳、甲烷和其他溫室氣體會釋放到空氣中。在提取和運輸化石燃料過程中也會釋放甲烷等溫室氣體。在自然濃度下的二氧化碳沒有害處,但過多時會如同在地球周圍包裹一層塑料,使得日照所吸收的熱度無法散出。這樣的大氣反應就像溫室一樣,因此這些排放氣體被稱為溫室氣體。

氣候變遷對加州有什麼影響?

在加州,氣候變遷帶來以下幾個方面的影響:

我們預期熱浪會更頻繁且為期更久,夏天更加乾燥。在溫暖的天氣下,煙霧形成的速度更快,對我們所有人都會造成健康危害,特別是嬰兒、兒童和老人。

chart shows the number of extreme heat days (10 days to 110 days)from 1950 to the year 3000 in 10 year increments. The chart also notes that the historical average number of extreme heat days is 4 and that the extreme heat day threshold is 97 degrees Fahrenheit. The chart shows that, in Los Angeles, the number of extreme heat days is projected to increase exponentially over time from a past norm of around 10 days to a future norm of over 80 days and growing. chart shows the number of extreme heat days (10 days to 110 days)from 1950 to the year 3000 in 10 year increments. The chart also notes that the historical average number of extreme heat days is 4 and that the extreme heat day threshold is 97 degrees Fahrenheit. The chart shows that, in San Diego, the number of extreme heat days is projected to increase exponentially over time from a past norm of around 10 days to a future norm of over 80 days and growing. chart shows the number of extreme heat days (10 days to 110 days)from 1950 to the year 3000 in 10 year increments. The chart also notes that the historical average number of extreme heat days is 4 and that the extreme heat day threshold is 97 degrees Fahrenheit. The chart shows that, in San Francisco, the number of extreme heat days is projected to increase exponentially over time from a past norm of around 10 days to a future norm of over 80 days and growing

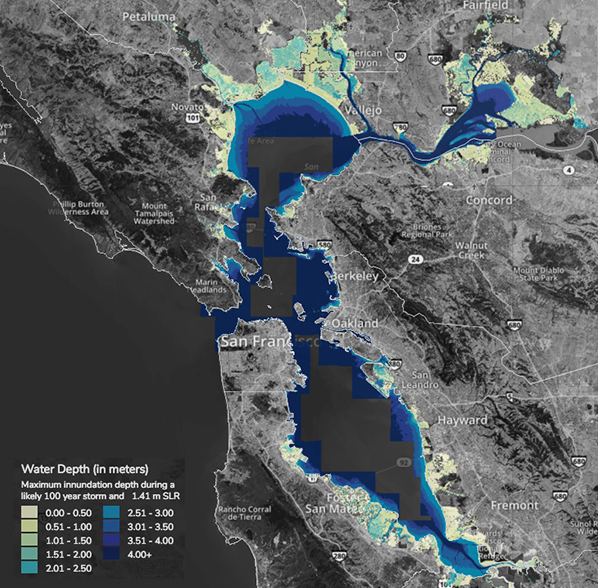
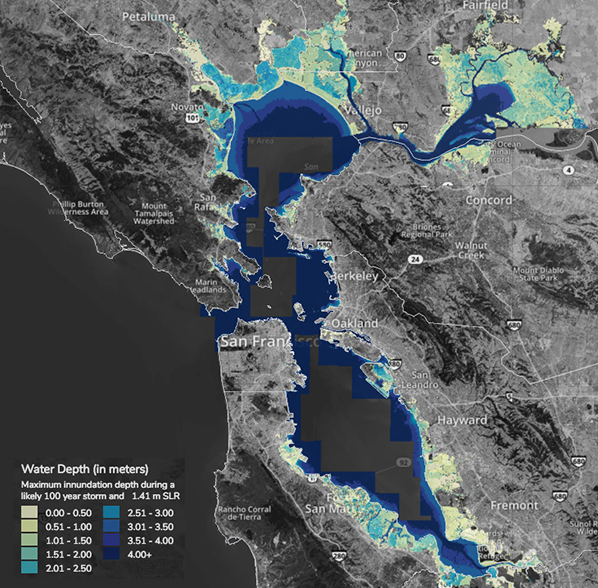
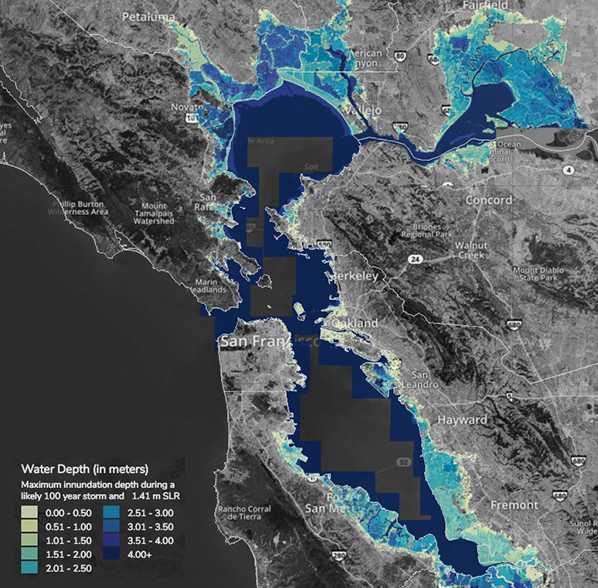
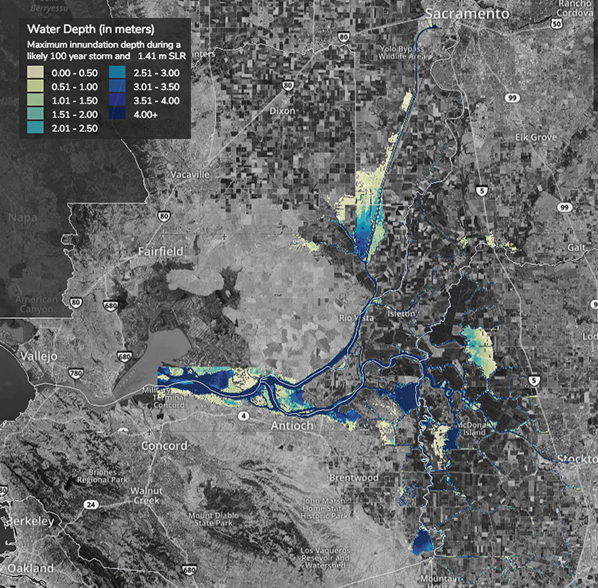
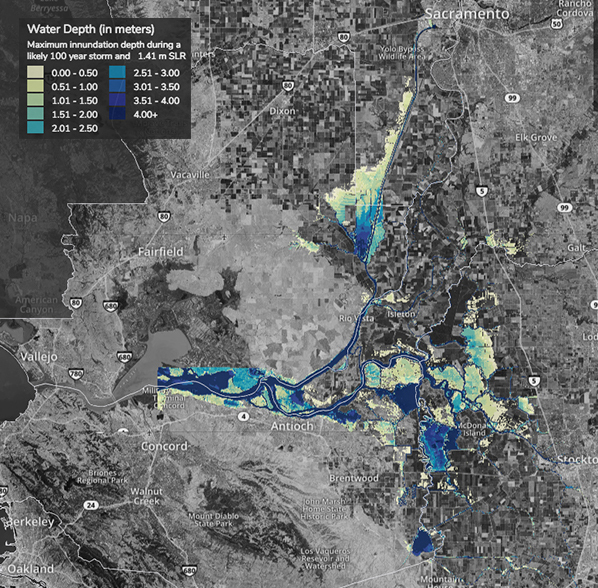
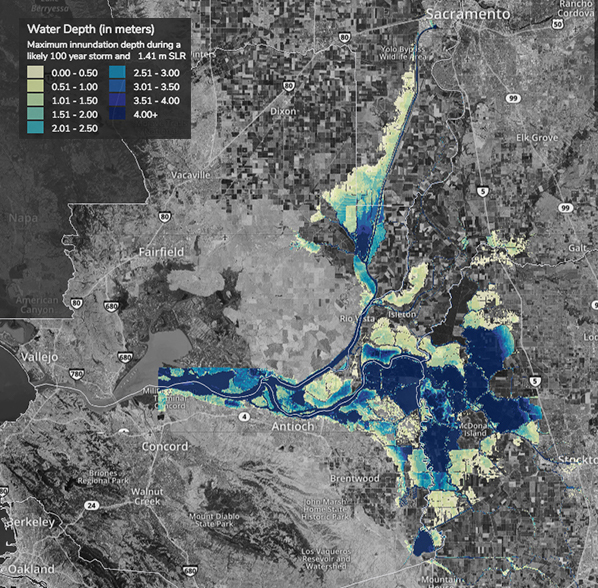
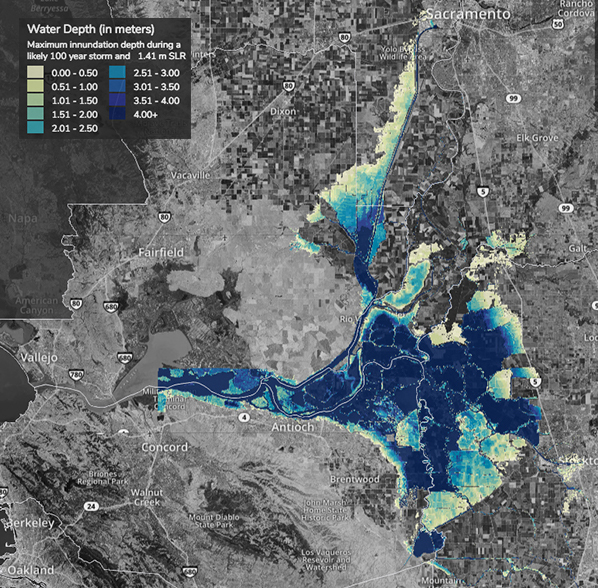
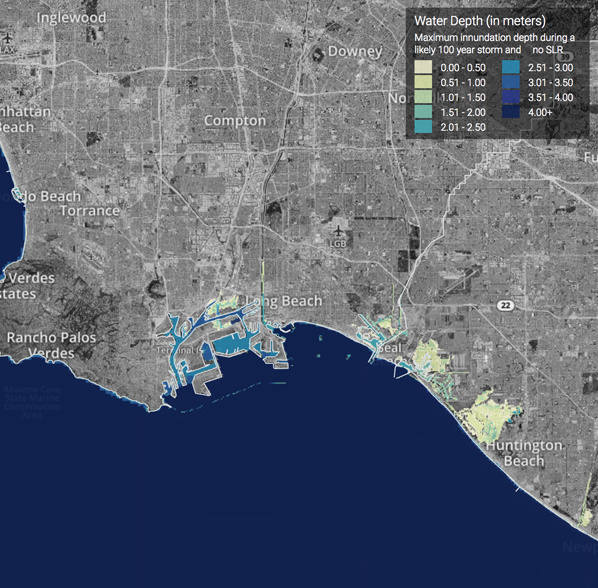
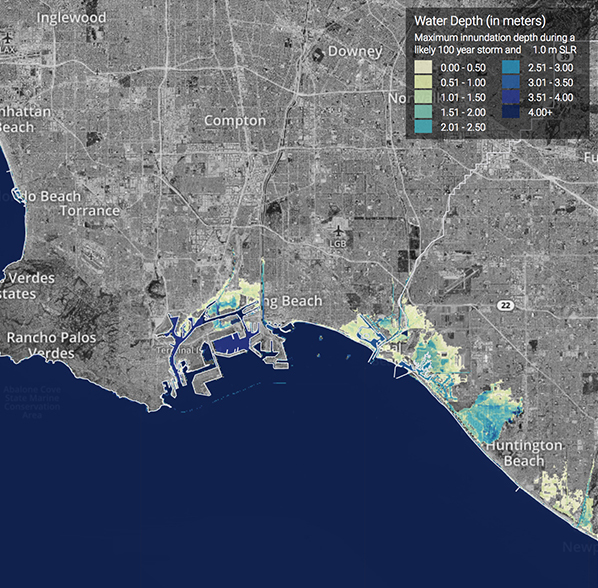
海平面預計在未來100年將上升高達8英尺。這可能造成遍及數百英里海岸線的嚴重淹水和侵蝕,對住家、農地和低窪城市造成極大影響。

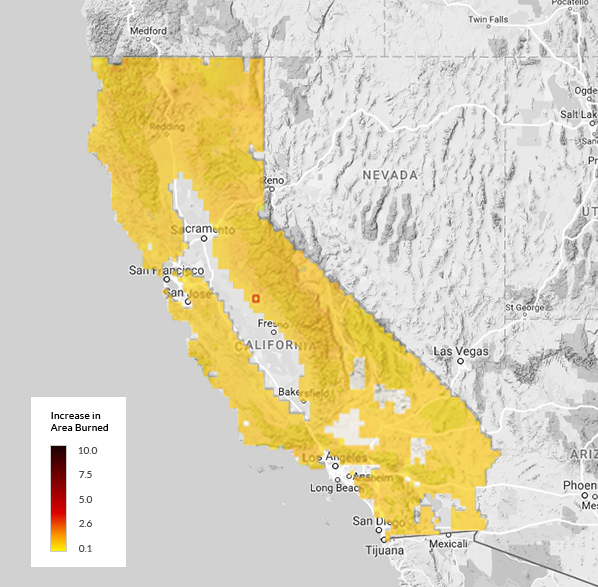
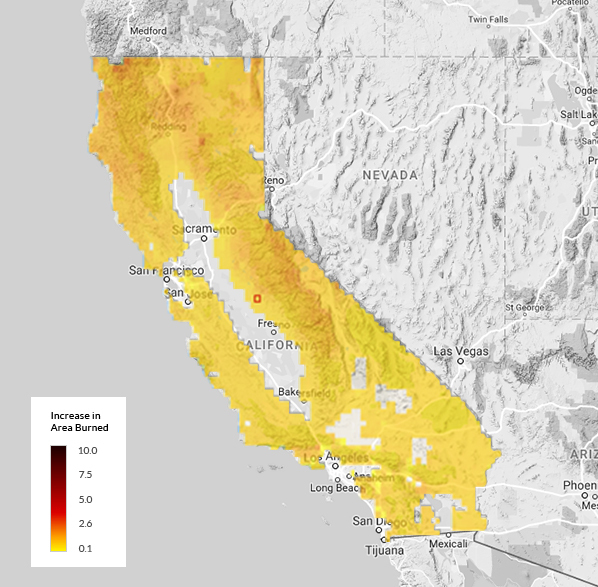
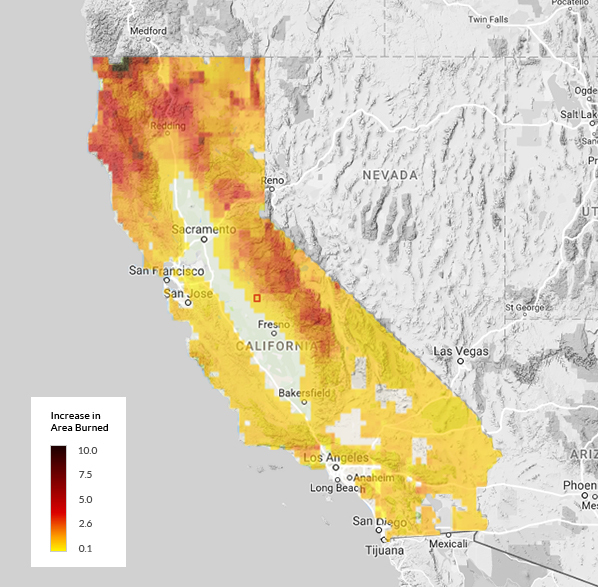
更多森林大火:隨著降雨模式的改變,森林將變得更乾燥,容易引發更頻繁劇烈的火災。火災會製造更多的碳至大氣中,又更加速了氣候變遷。

map of San Francisco Bay Area showing water depth, in meters, and associated maximum innundation depth during a likely 100 year storm and 1.41 sea level rise. Map shows highlighted areas mostly along the coastline of the San Francisco Bay and it's tributaries. map of San Francisco Bay Area showing water depth, in meters, and associated maximum innundation depth during a likely 100 year storm and 1.41 sea level rise. Map shows highlighted areas along the coastline, initially shown with no rise, now expanding further inland along the coastline of the San Francisco Bay and it's tributaries. map of San Francisco Bay Area showing water depth, in meters, and associated maximum innundation depth during a likely 100 year storm and 1.41 sea level rise. Map shows highlighted areas along the coastline, initially shown with .5 meter rise, now with more severity and expanding further inland along the coastline of the San Francisco Bay and it's tributaries. map of San Francisco Bay Area showing water depth, in meters, and associated maximum innundation depth during a likely 100 year storm and 1.41 sea level rise. Map shows highlighted areas along the coastline, initially shown with 1.0 meter rise, now with even more severity and expanding further inland along the coastline of the San Francisco Bay and it's tributaries. map of Sacramento-San Joaquin Delta Area showing water depth, in meters, and associated maximum innundation depth during a likely 100 year storm and 1.41 sea level rise. Map shows highlighted areas mostly along the coastline of the Sacramento-San Joaquin Delta and it's tributaries. map of Sacramento-San Joaquin Delta Area showing water depth, in meters, and associated maximum innundation depth during a likely 100 year storm and 1.41 sea level rise. Map shows highlighted areas along the coastline, initially shown with no rise, now expanding further inland along the coastline of the Sacramento-San Joaquin Delta and it's tributaries. map of Sacramento-San Joaquin Delta Area showing water depth, in meters, and associated maximum innundation depth during a likely 100 year storm and 1.41 sea level rise. Map shows highlighted areas along the coastline, initially shown with .5 meter rise, now with more severity and expanding further inland along the coastline of the Sacramento-San Joaquin Delta and it's tributaries. map of Sacramento-San Joaquin Delta Area showing water depth, in meters, and associated maximum innundation depth during a likely 100 year storm and 1.41 sea level rise. Map shows highlighted areas along the coastline, initially shown with 1.0 meter rise, now with even more severity and expanding further inland along the coastline of the Sacramento-San Joaquin Delta and it's tributaries. map of California Coast Area showing water depth, in meters, and associated maximum innundation depth during a likely 100 year storm and 1.41 sea level rise. Map shows highlighted areas mostly along the coastline of the California Coast and it's tributaries. map of California Coast Area showing water depth, in meters, and associated maximum innundation depth during a likely 100 year storm and 1.41 sea level rise. Map shows highlighted areas along the coastline, initially shown with no rise, now expanding further inland along the coastline of the California Coast and it's tributaries. map of California Coast Area showing water depth, in meters, and associated maximum innundation depth during a likely 100 year storm and 1.41 sea level rise. Map shows highlighted areas along the coastline, initially shown with .5 meter rise, now with more severity and expanding further inland along the coastline of the California Coast and it's tributaries. map of California Coast Area showing water depth, in meters, and associated maximum innundation depth during a likely 100 year storm and 1.41 sea level rise. Map shows highlighted areas along the coastline, initially shown with 1.0 meter rise, now with even more severity and expanding further inland along the coastline of the California Coast and it's tributaries.

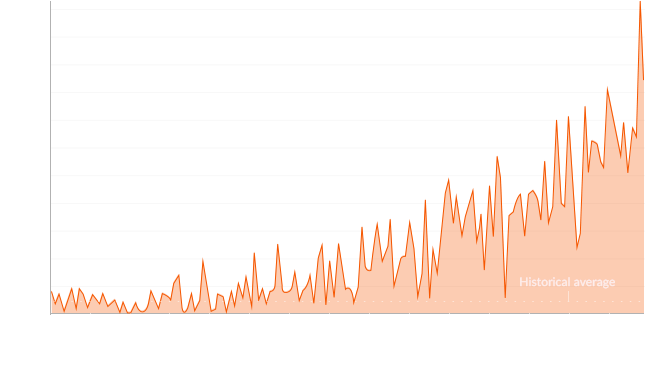
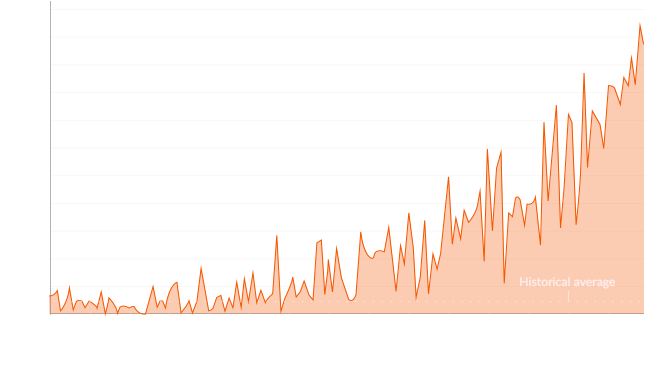
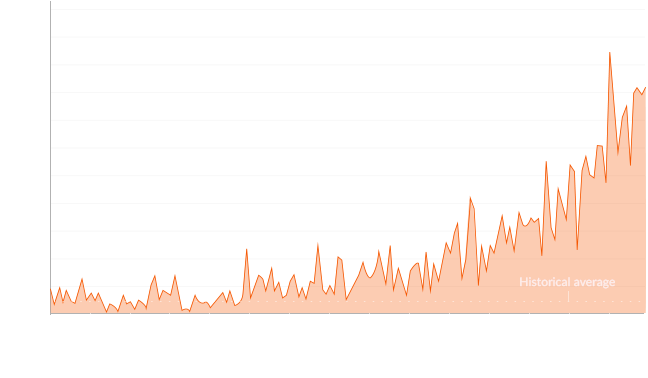
此氣候工具中的資料顯示在三種不同氣候模式和兩種不同情境下,預計增加的火災潛在區域。深橘色和紅色假設火災潛在區域增加高達10倍。

map of the state of California showing an Increase in area burned map key with a color indicator from .1 (yellow) to a 10 fold increase (dark red). With 2020 selected, the map shows a majority of the state highlighted in yellow map of the state of California showing an Increase in area burned map key with a color indicator from .1 (yellow) to a 10 fold increase (dark red). With 2050 selected, the map shows an update to a majority of the state to have a slight increase in area burned map of the state of California showing an Increase in area burned map key with a color indicator from .1 (yellow) to a 10 fold increase (dark red). With 2080 selected, the map shows a majority of the upper half of the state with a significant increase in area burned

維護欣欣向榮的加州

美國沒有任何其他州有跟加州一樣的自然美景、長達數英里的海岸線和舒適宜人的天氣。我們也是世界知名企業家、發明家和夢想家的發源地這些人相信我們只要下定決心就可以成就任何事情。理所當然我們喜歡住在加州。但我們所愛的加州正受到威脅。氣候變遷 已加重空氣污染、森林砍伐、海洋酸化、更多森林大火、乾旱、熱浪和海平面升高,這些都威脅到我們的健康、生計和未來。科學家和其他專家一致同意,為了避免氣候變遷的最嚴重後果,我們需要減少碳污染,而且刻不容緩。我們必須想辦法共同努力做出實際的重大改變,以保護我們現有的資源並為後代保留我們的自然資源。

我們領導走向潔淨能源的未來

我們要如何實現這個遠大目標? 每位加州人和在這裡營業的公司都需為此目標做出努力和奉獻。我們都需要為成功 提高能源效率、擁護潔淨能源和支持潔淨能源技術盡一己之力。透過實現這些目標,我們也將享有提早達成潔淨能源未來所帶來的好處。除了對抗氣候變遷效應外,我們在潔淨能源投資、就業和創新上的共同努力也可以提升加州當地的經濟發展。

你可以為氣候變遷做什麼?

我們每個人都可以採取一些行動來減少我們對環境的影響。在加州,我們個人影響最大的部分就是減少在居家、汽車和業務方面使用的能源。

Energy Upgrade California®加州能源升級計畫提供各種節約能源和用水的方法,讓你更輕鬆就能減少碳足跡 。您的水電瓦斯機關和市政當局也可能提供 退款補貼 和其他資源來協助您採取行動。

只要我們所有人都配合這項行動,簡單幾個動作就能產生巨大的改變。如果每個美國家庭都將一個白熾燈泡換成新的ENERGY STAR®能源之星節能LED燈泡,Environmental Protection Agency環保局(EPA) 估計我們可省下足夠三百萬戶家庭一年使用的能源,每年節省約6.8億美元的能源費用,而且每年減少九十億磅的溫室氣體排放量。


住宅能源效率

節省能源一點也不難。查看這些簡單的技巧,幫助您採取行動,節省能源並保護加州。
瞭解更多

節省能源一點也不難。查看這些簡單的技巧,幫助您採取行動,節省能源並保護加州。

節省能源比您想像的更加容易,這些簡單的技巧可以幫助您了解如何節省能源
瞭解更多